Equity Expected Returns
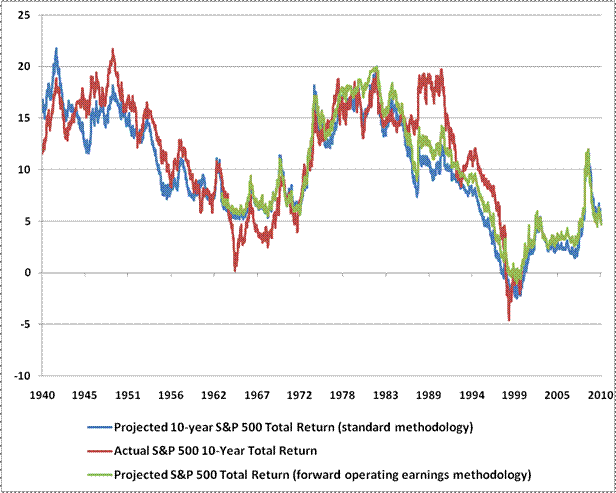
A central part of my practice is calculating the expected return for stocks. There are a number of great techniques for doing this. The following is from John Hussman’s weekly newsletter where he compares two different expected return techniques against actual 10yr returns over the last 70 years.
As you can see, the techniques work pretty well. They mainly fall down when PE ratios deviate from the norm for an unusually extended period of time. And these techniques currently project S&P 500 returns in the 5% (nominal) neighborhood. Using Shiller’s PE10 for estimating returns gives you a similar graph (see here for graph that includes Shiller data and for the technical details of how he does his projections).
If you assume valuations are not going to revert (i.e., stay at current high levels) and that inflation will meet expectations (around 2.7%) you could boost this number as high as 7% if you want to be optimistic. And if you think that tilting a portfolio to small and value adds another 1%, you could reach 8%. But expecting stocks to return higher than 8% over the next 10 to 15 years goes from “optimistic” to “dreaming”.
And emerging markets aren’t going to save this either. Their valuations are already on par with the US market and while their economies are growing much faster, this does NOT translate into much higher earnings growth for the stock market (it shows up as new capital formation/ new share issuance).

