4th quarter GDP came in at 5.7%. To see why people are not excited about this number check out the following graph.

If you look closely, you will see that imports and exports mostly balance each other and resdential and nonresidential investment are still lacking. This leaves inventory changes and consumption as the main drivers of the big gdp number. Since large inventory increases are not expected to continue, next quarter will be mostly driven by consumption, so a number closer to 2% seems more likely.
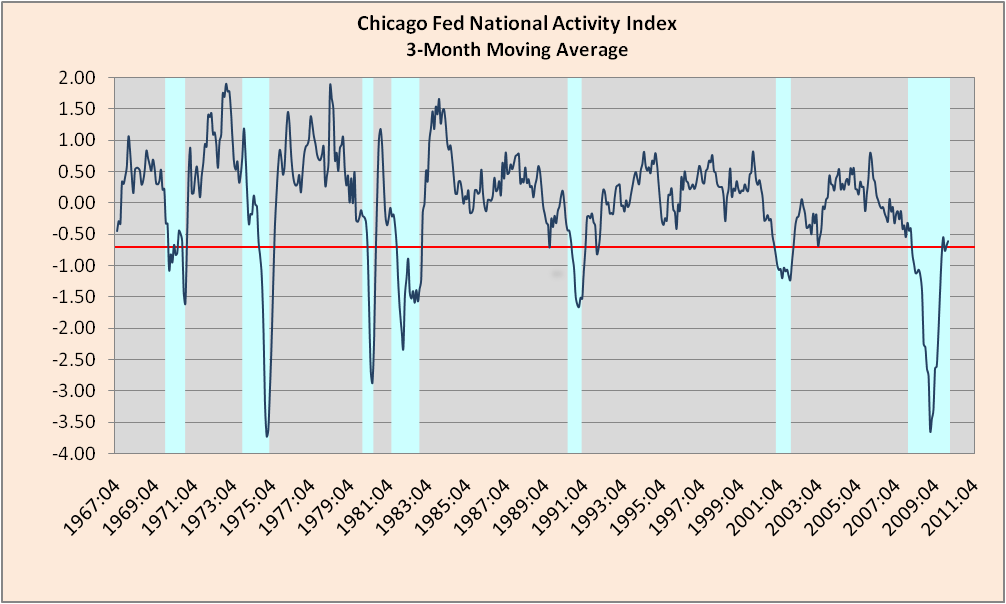
The Chicago Fed National Activity Index also came out with an update this week. It is an aggregation of 85 economic indicators. The monthly index went from -0.39 to -0.61 and the three month moving average went from -0.68 to -0.61. To help interpret the moving average the Chicago Fed gives the following advice.
When the CFNAI-MA3 value moves below –0.70 following a period of economic expansion, there is an increasing likelihood that a recession has begun.
When the CFNAI-MA3 value moves above +0.70 more than two years into an economic expansion, there is an increasing likelihood that a period of sustained increasing inflation has begun.
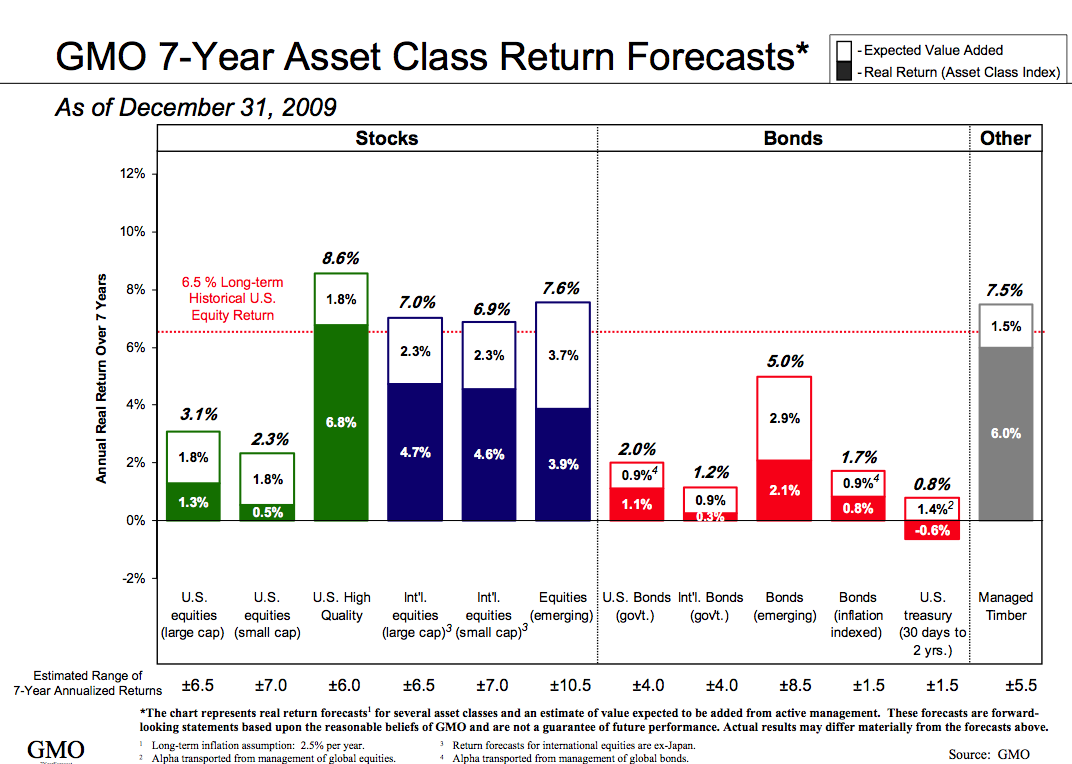
Lastly, GMO released their latest 7-year asset class forecast. These are real return estimates. I would focus on the solid color part of the graph. The white extension bars are the alpha amounts GMO expects their strategies to add to the asset class. I don’t agree with a number of these projects (i.e., I don’t think international and the US will be that dramatically different (i.e., I think the US will only do around 1% worse than international).

State of Economy — 2/1/2010
4th quarter GDP came in at 5.7%. To see why people are not excited about this number check out the following graph.
If you look closely, you will see that imports and exports mostly balance each other and resdential and nonresidential investment are still lacking. This leaves inventory changes and consumption as the main drivers of the big gdp number. Since large inventory increases are not expected to continue, next quarter will be mostly driven by consumption, so a number closer to 2% seems more likely.
The Chicago Fed National Activity Index also came out with an update this week. It is an aggregation of 85 economic indicators. The monthly index went from -0.39 to -0.61 and the three month moving average went from -0.68 to -0.61. To help interpret the moving average the Chicago Fed gives the following advice.
Lastly, GMO released their latest 7-year asset class forecast. These are real return estimates. I would focus on the solid color part of the graph. The white extension bars are the alpha amounts GMO expects their strategies to add to the asset class. I don’t agree with a number of these projects (i.e., I don’t think international and the US will be that dramatically different (i.e., I think the US will only do around 1% worse than international).
This entry was posted by David on February 1, 2010 at 8:16 am, and is filed under Commentary. Follow any responses to this post through RSS 2.0.You can leave a response or trackback from your own site.