Too much risk in your portfolio?
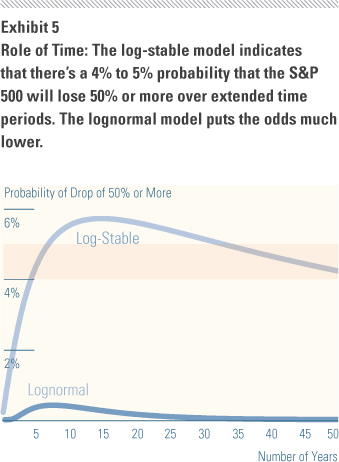
The following graph comes from a recent morningstar article that reiterates how markets don’t follow normal distributions but instead follow a log-stable style distribution (i.e., distribution with fat tails). What I like about this graph is that it highlights the fact that even over very long periods (e.g., 50 years), you still have over a 4% risk of more than a 50% loss over that period.
If you have a hard time fathoming how that could happen, just look at Japan. It has now been over 20 years since the Nikkei peaked at around 39K. It is now under 8K.
What this means is that if a 50% loss to your equity investments would be catastrophic to your goals, you need to revist your risk exposure. After all, the risk of dying for people under the age of 60 is generally less than 1%, but it is still considered prudent to buy life insurance. A 4% risk of catastrophic failure is too high to leave unaddressed.
Of course, this requires understanding what is catastrophic. For some it might mean having to sell the house and move in with their children for support, while for others it could just be a significantly diminished lifestyle (e.g., no travel, no/less dining out, etc).

