2/9 Economic News in Graphs
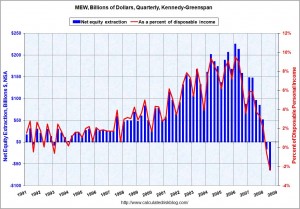
People were supplementing their disposible income to the tune of 5% to 9% during the housing bubble. This means $400 billion to $800 billion of annual spending that occurred from 2002 – 2007 has now been withdrawn from the economy.
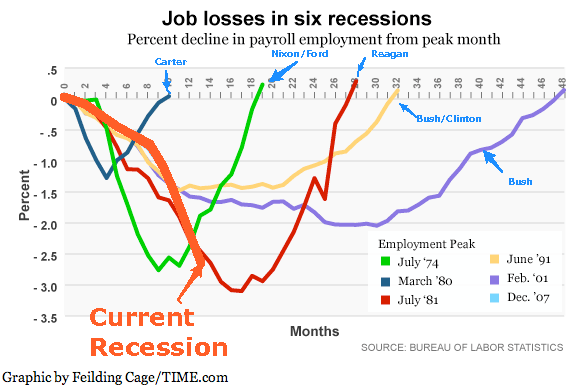
Job losses haven’t gotten as bad as the early eighties yet, but it looks like we will make a go of it in a few months.
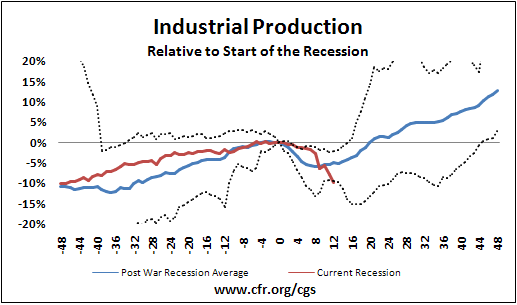
In the following graph the dotted lines are maximum and minimum historical production values during recessions post world war II.
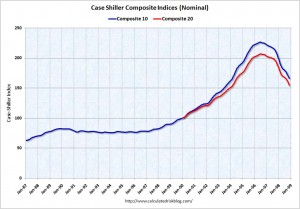
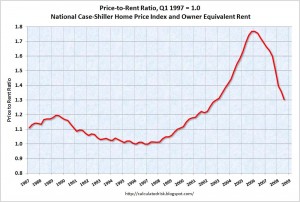
Housing still has more to fall.

