The latest Case-Shiller monthly Home Price Indices for December came out today. Home prices have continued to fall. If we look at housing costs through a variety of metrics we see that we are just starting to get down to the level of previous highs. To get back to historical average valuations would require another 10% drop and if housing overshoots (like most cycles do) it could easily drop 20% from the current level.
CalculatedRisk makes some of the best graphs to help visualize this information. If you want to follow the housing market closely the blog is a key one to read. He provides three valuation metrics: real prices, price to rent ratio and price to income ratio. They clearly show why trying to prop up prices at their current levels is a mistake. Housing needs to become more affordable so we can again have the chain of purchases from starter homes to larger homes. Right now we have lost the bottom rung of this chain which disrupts the whole system.
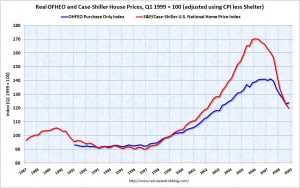
Real Prices

The OFHEO numbers are less bubbly because it tracks mostly prime loans and not the more exoctic interest only and sub prime loans.
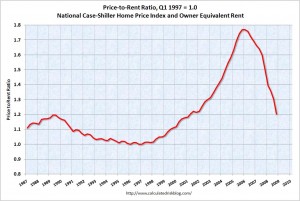
Price to Rent

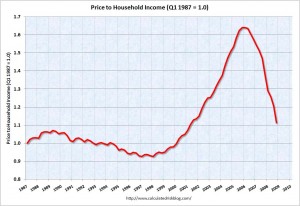
Price to Income

2/24/09 Housing Update
The latest Case-Shiller monthly Home Price Indices for December came out today. Home prices have continued to fall. If we look at housing costs through a variety of metrics we see that we are just starting to get down to the level of previous highs. To get back to historical average valuations would require another 10% drop and if housing overshoots (like most cycles do) it could easily drop 20% from the current level.
CalculatedRisk makes some of the best graphs to help visualize this information. If you want to follow the housing market closely the blog is a key one to read. He provides three valuation metrics: real prices, price to rent ratio and price to income ratio. They clearly show why trying to prop up prices at their current levels is a mistake. Housing needs to become more affordable so we can again have the chain of purchases from starter homes to larger homes. Right now we have lost the bottom rung of this chain which disrupts the whole system.
Real Prices
The OFHEO numbers are less bubbly because it tracks mostly prime loans and not the more exoctic interest only and sub prime loans.
Price to Rent
Price to Income
This entry was posted by David on February 24, 2009 at 2:16 pm, and is filed under Commentary. Follow any responses to this post through RSS 2.0.You can leave a response or trackback from your own site.