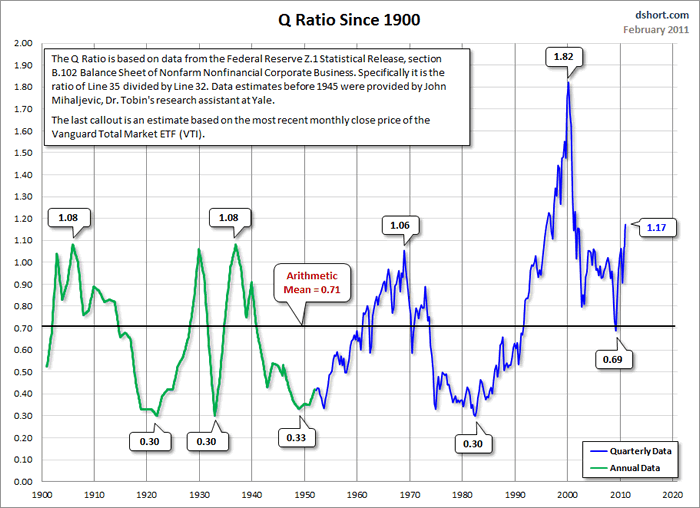
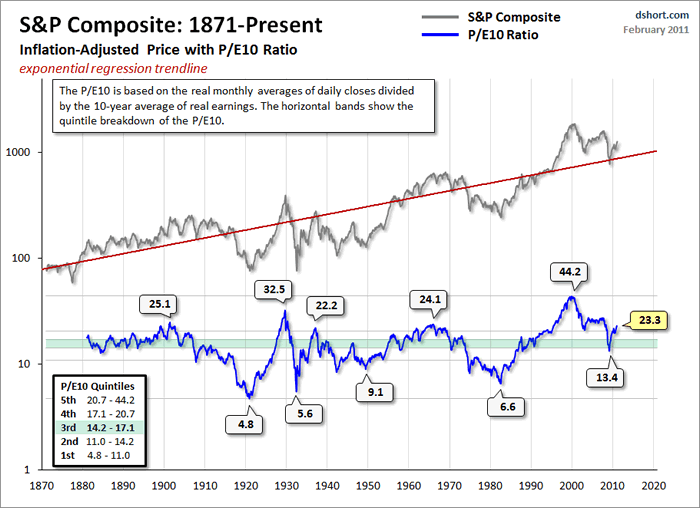
Whenever someone puts together some nice valuation charts I feel compelled to share :-). The story they tell is the same. If you only consider the last 20 years, current valuations look about average. If you look over the last century however, we are currently in the top quintile of valuation and expected returns going forward should be significantly less than the historical norms.
I have no idea when we might drop to the lower quintiles. As you can see in the graphs, markets can stay over and under valued for decades. So make sure you manage the risk!


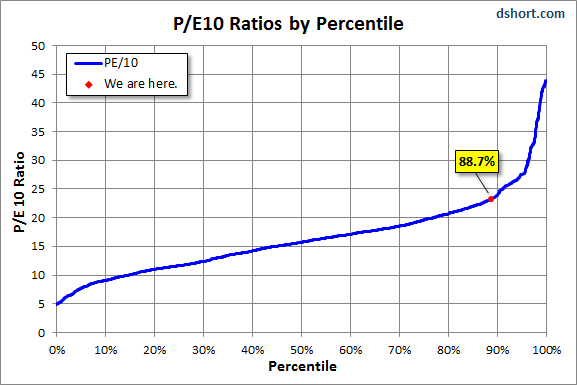
This last graph shows that the PE10 has been lower 88% of the time historically.
Sources:
Market Valuation Update
Whenever someone puts together some nice valuation charts I feel compelled to share :-). The story they tell is the same. If you only consider the last 20 years, current valuations look about average. If you look over the last century however, we are currently in the top quintile of valuation and expected returns going forward should be significantly less than the historical norms.
I have no idea when we might drop to the lower quintiles. As you can see in the graphs, markets can stay over and under valued for decades. So make sure you manage the risk!
This last graph shows that the PE10 has been lower 88% of the time historically.
Sources:
This entry was posted by David on February 10, 2011 at 12:33 pm, and is filed under Commentary. Follow any responses to this post through RSS 2.0.You can leave a response or trackback from your own site.