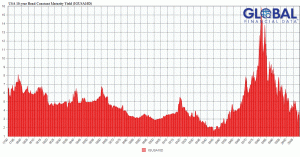
Long Term History of US Interest Rates
It is often humbling to look at long periods of history and realize that while their is certainly rhyming that goes on, predicting the future is fraught with long term unresolvable uncertainties. The following graph shows a history of US ten year treasury yields (or their proxy) since 1790. It is useful to remember that these are nominal interest rates.
Interest rates below 5% are clearly the historical norm, but risk management means addressing the high inflation/ high interest rate scenario to ensure that won’t ruin you.

