Market Valuation Update
After the rundown we have had over the last two weeks, I find it useful to take a step back and check on how current valuations measure historically. I should reiterate that I don’t believe that I have the ability to time the market. And for me, these valuation exercises are about assessing risk so that I don’t expose my client’s to more than their plan can handle while trying to capture world economic growth.
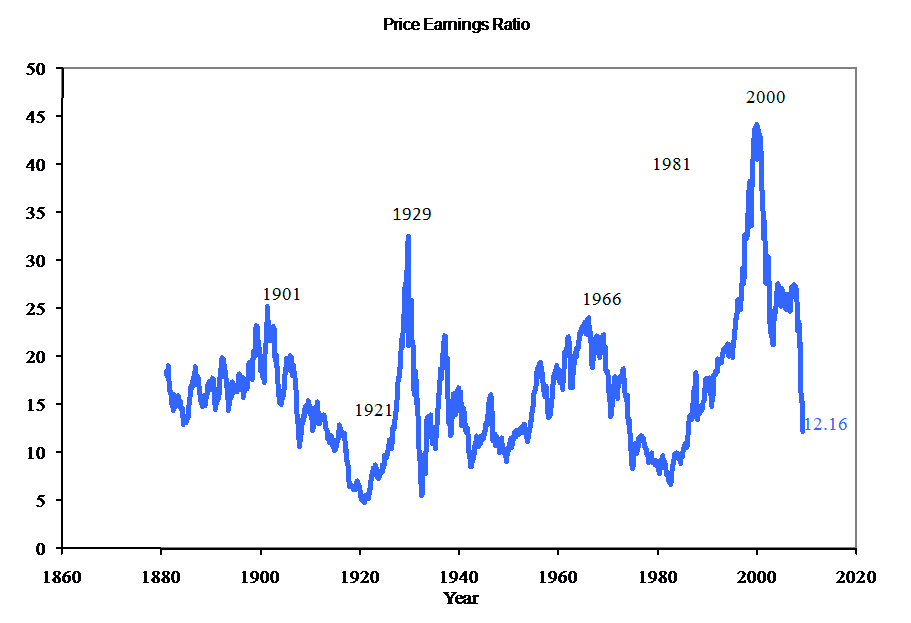
PE10 (i.e., using real earnings averaged over last 10 years) is currently at 12.16. As you can see in the following graph this is below the historical average (16.3) but not yet below the level typically achieved in previous long term down turns (<10).
So clearly there is still room for prices to fall. In fact, the S&P 500 would have to fall into the 500’s to drop the PE below 10. This brings me to the next graph produced by Doug at dshort.com.
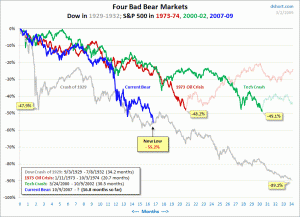
The great depression line is tracking the Dow while the other three track the S&P 500. I love two things about this graph. The first is how it demonstrates how much risk is still potentially waiting below the surface. Second, I believe it illustrates the difficulty of discerning the bottom. After each bounce off a new low it is extremely difficulty to tell whether the rally it a true one or not. Looking at this graph you can see a sucker rally of over 40% gains before plunging again to new lows.
To end on a positive note. Demand in many durable goods has gone way below their normal replacement rate. This means demand is at unsustainably low levels. Regardless of how the economy is doing they will have to come up from their current levels as these items wear out. This means if the economy stays bad, durable good categories will still improve over the next few years. And if the economy improves, durable goods could see quite a pop in demand.
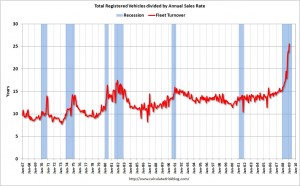
To see this effect in car sales Calculated Risk provides this graph showing the total number of registered vehicles in the U.S. divided by the sales rate – and gives a turnover ratio for the U.S. fleet (this doesn’t tell you the age of the fleet). As you can see it is currently over 25 years which is unsustainable.


