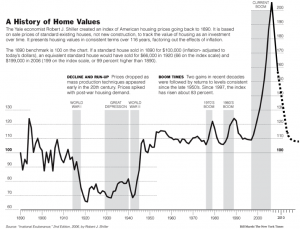
Versions of this chart have been floating around for a while. This one is updated with the latest numbers. As you can see, there is still plenty of room for housing prices to fall further. Future market are predicting around another 15% decline before bottoming out in 16 months or so. If markets were to follow the dotted line, that would mean a decline more than double that.

Updated Case Shiller Housing Price Chart
Versions of this chart have been floating around for a while. This one is updated with the latest numbers. As you can see, there is still plenty of room for housing prices to fall further. Future market are predicting around another 15% decline before bottoming out in 16 months or so. If markets were to follow the dotted line, that would mean a decline more than double that.
This entry was posted by David on December 30, 2008 at 1:39 pm, and is filed under Commentary. Follow any responses to this post through RSS 2.0.You can leave a response or trackback from your own site.