Determining Expected Return from Stocks
Whenever fear levels are high, I find it comforting to go over the fundamentals of investing. Today I am revisiting how you should set your exptations for long term returns from equities.
Equity returns come from the following sources
- Dividends
- Earnings growth
- Price/Earnings ratio expansion or contraction
- Inflation
I’m going to focus on expected real return and therefore leave inflation out of the calculation, but it is easy to add back in later if you wish.
Dividends
IndexArb provides a quick estimate of the current S&P 500 dividend yield. It is currently around 3.1%. Historically the dividend yield has averaged around 4.5%, but companies have drifted trowards distrubuting less of their earnings.
Earnings Growth
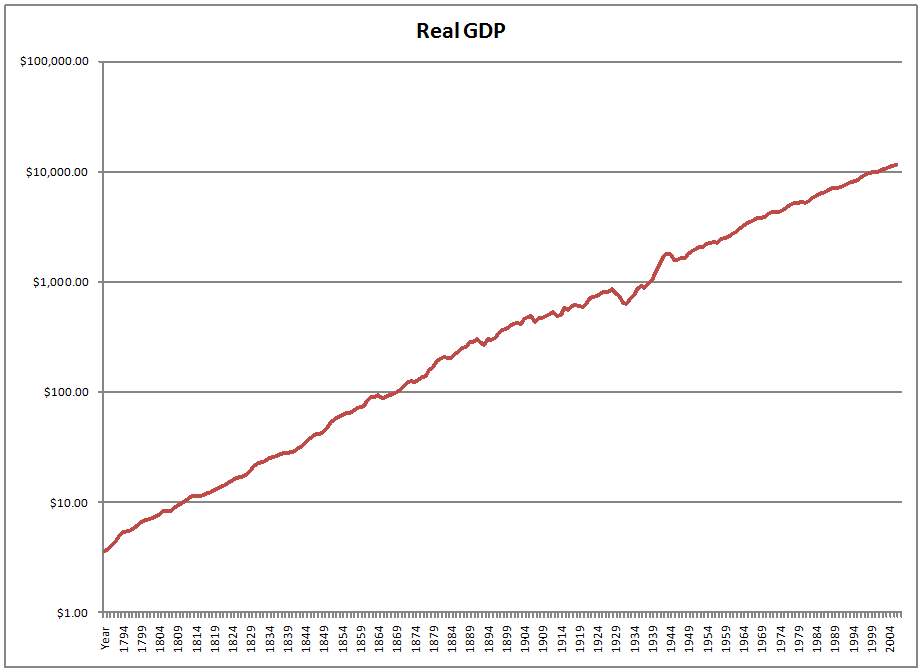
Over the last 130 years real earnings (i.e., earnings with inflation taken out) have grown at an annualized rate of around 1.7%. Unfortunately, over the long term this number is unlikely to significantly increase. While corporations have been retaining more of their earnings to try and increase their growth, their record of success has been minimal. Furthermore, consider the following graph of US Real GDP over the last 200 years.
Considering all the wars and recessions that have gone on in the US during this time period the steady long term growth at a fairly fixed rate should be comforting for those who fear for our future. However, it should also be sobering for those who think growth will be dramatically higher going forward. And in the long run, real earnings growth is constrained by GDP growth.
Price/Earnings Expansion or Contraction
This is the most difficult component to predict since it is largely driven by the psychology of investors. Historically this ratio (using average real earnings for the last 10 years to smooth over business cycles) has averaged around 16.3. But is has gone as high as 44 and low as 5. It also can take as many as 17 years for PE10 to move from above average to below average or vice versa.
This means that if your investment horizon is at least 17 years out, you can be fairly confident that the PE10 will cross its average during your investment horizon, so you can factor in the reversion to the mean into the expected return.
For example, if the PE10 is currently 14.2 then the additional expected return PE10 reversion would provide is (16.3/14.2)^(1/17). This works out to around and extra 0.8% of expected return.
All Together
Putting it all together we get a current expected real return of 3.1% + 1.7% +0.8% = 5.6%.
Caveats
This calculation is for the S&P 500 (i.e., the US stock market as a whole). Similar analysis would need to be done for international and emerging markets to determine their expected returns. This analysis also does not factor in any potential premiums from portfolio tilts towards small, value or other weighting schemes that differ from market capitalizations (e.g., fundamental indexes).

